Insight6 min read
Introducing GA4Sight: Helping you make the most of Google Analytics 4
Mon May 27 2024 | James Betts
- Insight
- Intelligence
- Analytics
Tags
Analytics. Love them or loathe them, we all need to use them.
There’s no denying that from a data-processing perspective, Google Analytics 4 is leaps and bounds ahead of the now-defunct Universal Google Analytics. GA4 aims to connect user journeys across devices with enhanced tracking via Google Signals. It also uses machine learning to model any data that is absent due to cookie policies.
But despite these advancements, the digital marketing industry has struggled to get to grips with GA4 since its final rollout in July 2023. We’ve therefore set out to try to simplify the system and generate meaningful insight for you with GA4Sight.
So, what’s the problem with GA4?
From newcomers in data analysis to experienced hands, we’re hearing across the board that trying to gain meaningful insight from GA4 has become harder.
A less intuitive user interface and a new approach to the presentation of data have left many users scratching their heads and questioning how they can effectively use the platform.
If you’re struggling to get to grips with the platform, you’ll find it difficult to access the data you need to make important strategic decisions.
How does GA4Sight help?
- An interface you can understand: GA4Sight uses Looker Studio to provide a simple dashboard that offers the top-level insight you need. You get to leverage GA4’s advanced machine learning capabilities and data modelling systems without the pain of navigating its interface.
- Linked to your Google Analytics account: The dashboard is yours to keep and the data updates every time GA4 does. It’s a long-term solution to the most basic issue with GA4.
- Support decision-making: Having this essential data at your fingertips means you can quickly see where you need to invest budget or how you should shift your strategy.
- Useful regardless of size: If you discover something, we can investigate further for you. You can then try to learn from the data and replicate it across other channels.
What’s included in GA4Sight?
You’ll get the key information that can be extremely tough to derive from the GA4 interface.
All the data provided through our dashboarding is filterable by date, acquisition channel and product category. This means you can hone in on a specific channel or product, or combine them all to drill down into a smaller subsection of the available data.
But here’s a breakdown of what you can expect from your GA4 dashboard. Remember, though, that we can always help you take a closer look at anything that piques your interest.
Commercials
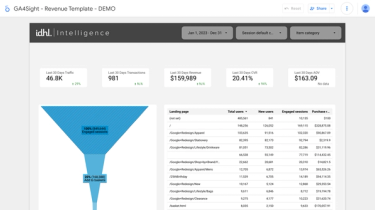
Our dashboarding starts with top-level commercial metrics across traffic, transactions, revenue, conversion rate (CVR), and average order value (AOV). This is shown for the past 30 days and provides a comparison to the previous 30-day period.
Purchase funnel
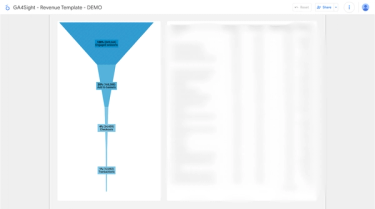
Those commercial metrics inform a four-stage purchase funnel. This lets you identify where the dropouts and opportunities lay from acquisition to add-to-baskets, checkouts and conversions.
If you want to probe further, we can help you make use of Enhanced Ecommerce in GA4 to gain insights such as:
- How many products have been viewed/clicked
- How many products got added to basket
- How many products got removed from basket
- The stage of the checkout the user got to before failing to convert
Landing page data
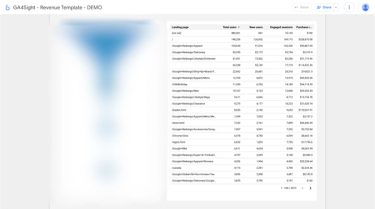
The purchase funnel is supported by landing page acquisition data. We’ve pulled together the above table to provide you with oversight on which pages are driving traffic, conversions, and more.
It’s extremely hard to collate this information in GA4, but it’s a simple way to inform your strategy. If you know how each page is performing, there may be tactics that you can replicate on underperforming pages to drive increased revenue.
Traffic and revenue
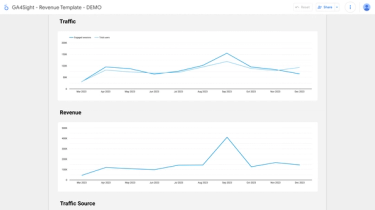
Take a look at how your engaged sessions, total users and purchase revenue have varied by month in the traffic and revenue sections.
You’ll also get access to:
- Traffic source: How much traffic each channel is driving to your site and how that varies on a month-by-month basis.
- Revenue by device category: Gain awareness of how users convert on your site.
Should you see any red flags, let us know and we can discuss them with you. We’re also able to visualise more data for you to deepen the level of insight you get.
High performing sources
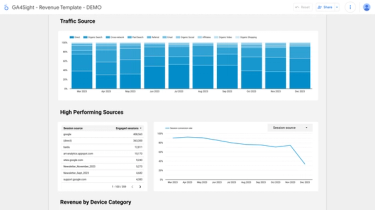
A key highlight of the dashboard is the high performing sources section. It shows you where your traffic is coming from and whether those sources are overperforming or underperforming from a conversion rate perspective. This can highlight areas of opportunity and improvement.
You can filter down to see the conversion rate of any session source, with trends in that data potentially providing information that’s worth looking into.
Use GA4Sight to unlock your analytics today
All this data can provide a springboard for development in the performance of a website, acquisition channels and reporting.
Our dashboarding is highly customisable, enabling us to dig into that next layer of information and help you discover your next best actions and areas for improvement.
If you’re finding GA4 harder to manage and have been questioning how on earth to make the most of the platform, we can make things that little bit easier for you. Get in touch with our team of experts.